
Zhong Ninghua: Understanding Domestic Circulation from Interprovincial Freight Transport
Wed, May 24, 2023
Accelerating the creation of a new development pattern is a strategic decision made by the Central Committee of the Communist Party of China based on the Second Centenary Goal and the coordination of development and security. Domestic circulation is the mainstay of the new development pattern, and smooth domestic circulation is of great significance to effectively expanding domestic demand and grasping the initiative of development. In order to strengthen internal forces and reliability of domestic circulation, China must maximize the effectiveness of its super-large market scale, expand the scope of transactions, deepen the division of labor system, unleash potential demand and strengthen supply capacity. However, in reality, there are many barriers to inter-regional contacts due to factors such as transport costs, transaction fees and regional trade protectionism, which has led to the creation of various localized small circulations. There are still bottlenecks and obstacles in domestic circulation. Therefore, it’s crucial to develop indicators and measure the extent and depth of domestic circulation. This is the first article in a series based on recent research our team conducted in this area. By studying freight transport on inter-provincial expressways across China, this article aims to probe into the extent of participation of provinces and municipalities in domestic circulation and the underlying reasons that influence the said extent of participation.
Understanding economic connections from interprovincial freight transport
Data used in this study is the expressway network toll collection data of 29 provinces, municipalities and autonomous regions (collectively, “provinces”) in 2021 (excluding Hainan Province, Tibet Autonomous Region, Hong Kong, Macao and Taiwan), based on which the freight transport volume was calculated, including intra-provincial and interprovincial ones.
In 2021, all Chinese highways had accomplished 70% of the freight transport volume under the comprehensive transport system, according to relevant statistics from the National Bureau of Statistics and the Ministry of Transport. Although the traffic mileage of expressways only accounted for 3.20% of the total mileage of highways, expressways were involved in transporting more than 60% of the total freight volume of highways, or close to half of China’s total freight transport volume. Therefore, the freight transport volume of expressways can reflect the situation of interprovincial freight exchanges. More importantly, from freight transport between any two provinces contained in the data, we can understand the connection between a province and other provinces in terms of freight transport and the strength of the connection.
Figures 1 and 2 show the top five provinces with the most freight exchanges with Beijing, Shanghai, Guangdong and Sichuan. Figure 1 shows the destinations of freight transport leaving the provinces and Figure 2 shows the origins of freight transport entering the provinces. We can see from the figures that freight transport of these provinces was mainly with neighboring provinces. There were relatively fewer, but still significant, freight exchanges existed between non-neighboring provinces. For example, the two pairs of non-neighboring provinces, Guangdong and Sichuan and Guangdong and Shanghai, had significant two-way freight exchanges, showing a high degree of interdependence despite the long distances.
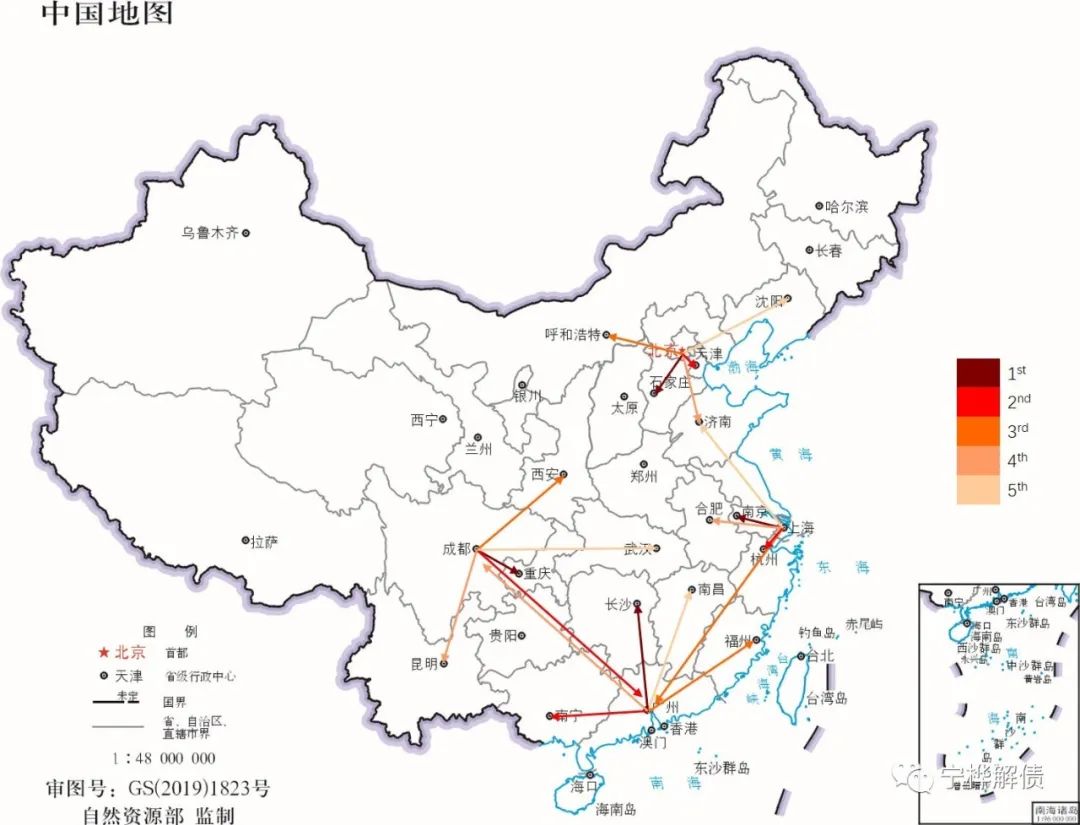
Figure 1 Distribution of Top Five Destinations of Freight Transport Leaving Four Provinces

Figure 2 Distribution of Top Five Origins of Freight Transport Entering Four Provinces
Interprovincial Freight Supply and Demand Index (FI)
Due to the high intensity of two-way freight exchanges between Guangdong and Sichuan and between Guangdong and Shanghai, we came to the conclusion that transport distance must be considered while developing a unified national market indicator to reflect domestic circulation. Long-distance transport results in higher costs. If two distant provinces have a significant volume of freight transport, it is likely that the division of labor has been formed in the industrial chain and it is very difficult to replace, i.e., substitutes cannot be found in neighboring provinces. We believe that such an inter-regional division of labor and the continued deepening thereof is one of the key points for keeping domestic circulation unimpeded.
Based on the above, we created the “Interprovincial Freight Supply and Demand Index” (hereinafter referred to as FI) that takes into account both the weight and actual transport distance of goods. Subsequently, we standardized the FI. If FI is greater than 1, it means that the intensity of interprovincial freight transport in a province is higher than the national average and relatively more active, with relatively high participation in domestic circulation; if FI is less than 1, it indicates that the interprovincial freight exchange in a province is relatively less active.
Figure 3 shows the FI of the 29 provinces. From the perspective of regions, the eastern region has the highest FI, the central region is slightly lower than the average, and the western region has a large gap with the average. From the perspective of provinces, 11 provinces have an FI higher than the national average, including seven in the eastern region and only two in the central and western regions, respectively.
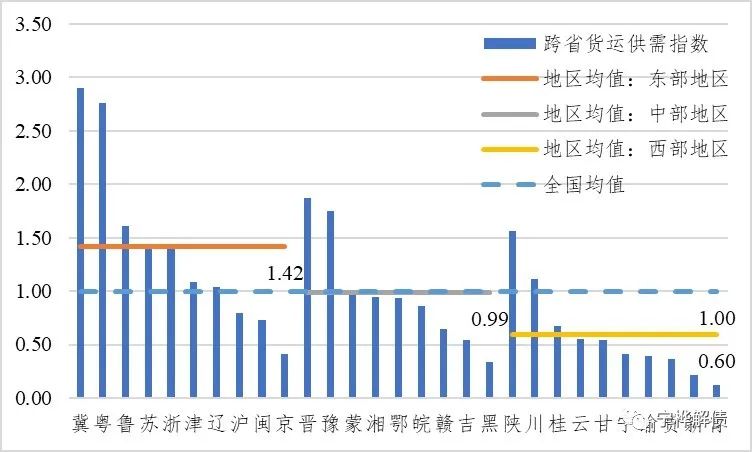 Figure 3 Interprovincial Freight Supply and Demand Index (FI)
Note: Provinces in the figure are divided into eastern, central and western regions and are arranged based on the index from high to low within respective regions.
Influence of economic structure on interprovincial freight supply and demand
The FI depicts the total interprovincial freight volume within a province, taking into account the transport distance. However, is the index the higher, the better? In other words, can we simply compare the value of FI between provinces? To answer these questions, we need to further analyze which factors will significantly influence the FI. Our team believes that the main factors influencing the FI include economic scale, economic structure, and imports and exports.
(I) Economic scale
Figure 4 shows that economic scale is an important factor influencing the FI. For example, the differences in the FI between Beijing, Shanghai and Guangdong can be partially explained by their economic scale. The three provinces lead in economic strength nationwide, however, the economic volume of Beijing and Shanghai is smaller than that of Guangdong and so is their FI.
On the other hand, the economic scale does not fully correspond to the FI. For example, Hebei, Shanxi and Shaanxi have a very high FI while Jiangsu, Zhejiang and Shandong do not have a particularly high FI.
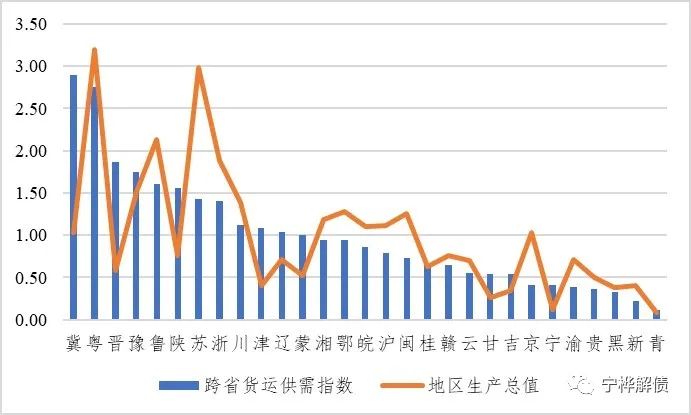 Figure 4 IF and Gross Regional Product (GRP)
Note: Provinces in the figure are arranged based on the FI from high to low.
(II) Industrial structure
By further distinguishing the industrial structure, we could find that, in the GDP structure, the secondary industry has a high correlation with the index (Figure 5). The internal structure of the secondary industry is also an important factor. If the secondary industry of a province is mainly traditional manufacturing or mining, the products may be heavy with low value-added, leading to significant transport demand and generally a higher FI. Provinces such as Hebei, Shanxi and Shaanxi may fall into this situation. On the other hand, if the secondary industry of a province is based on products with high value-added that are generally lightweight, the FI of that province may be relatively lower. Jiangsu Province may fall into this situation.
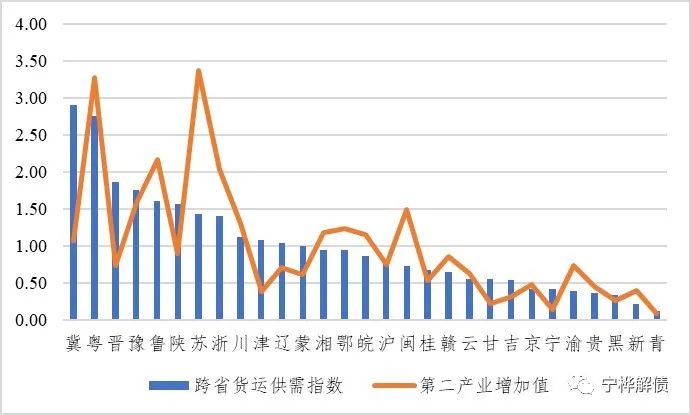 Figure 5 FI and Value-added of Secondary Industry
Note: Provinces in the figure are arranged based on the FI from high to low.
(III) Imports and exports
Imports and exports negatively impact the FI because they are substitutes for interprovincial freight transport, leading to a negative correlation. For example, the lower FI of Zhejiang Province can be explained by its international freight transport. Its total export-import volume and international trade influence are leading in China.
Conclusion
With a vast territory and the most complete and largest industrial system in the world, China can rely on domestic industrial division and trade support to improve its industrial system and thus drive high-quality and sustainable economic development. For this purpose, it is necessary to keep domestic circulation unimpeded. Our team, from the perspective of interprovincial freight transport, has described the extent to which provinces participate in domestic circulation and preliminarily discussed the influencing factors. According to our analysis, the scale of interprovincial freight transport volume with transport distance considered depends on the economic scale, industrial structure and imports and exports. However, more subsequent analyses are needed for further understanding each province’s performance in this index and the underlying reasons therefor.
This article is an achievement of the Major Project of the National Social Science Fund of China (19ZDA073).
ADD:Tongji Building A, Siping Road 1500, SHANGHAI 200092
TEL:0086-21-65983943
FAX:0086-21-65986304
Quick Links:Tongji UniversityMMBSMBSCWRXLRI

We protect your privacy. We use cookies to personalize content, provide features, and analyze traffic to our website anonymously and in a privacy compliant manner. By law, we may store cookies on your device if they are strictly necessary for the operation of this site. For all other cookie types, we need your permission. For more information, please see the privacy policy linked below.

