
Some Questions on Chinese Economic Development since 2008
Fri, Jan 19, 2018
Why the financial sector does not support the real economy?
How to de-leverage and stabilize growth?
ZHONG Ninghua, Professor of Tongji SEM
Question: Since the financial crisis in 2008, the Chinese economic growth rate has declined from double-digit percentage before 2008 to recent 6.7%, which has increased the downward pressure on economy. It has incurred hot discussions at home and abroad, and some foreign scholars and investors even expressed their concerns. Then, how do you look at the economic performance in China?
ZHONG Ninghua: Firstly, I don’t think the decelerated GDP growth is a serious problem, because, it is mainly the result of increased cardinal number. For example, the GDP of China was CNY 31.7 trillion in 2008 and CNY 63.6 trillion in 2014. The latter was nearly two times of that of 2008. It means that the absolute value of 10% growth of the GDP in 2008 equals to that of 5% growth of the GDP in 2014.
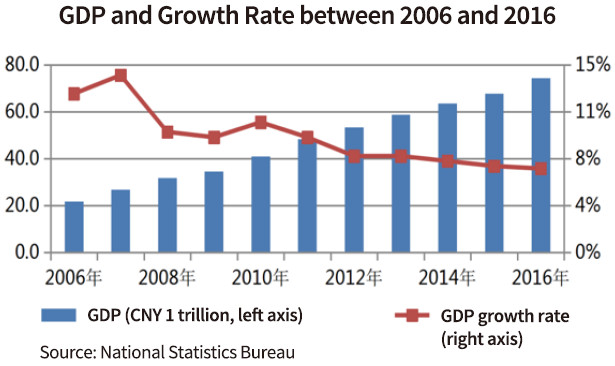
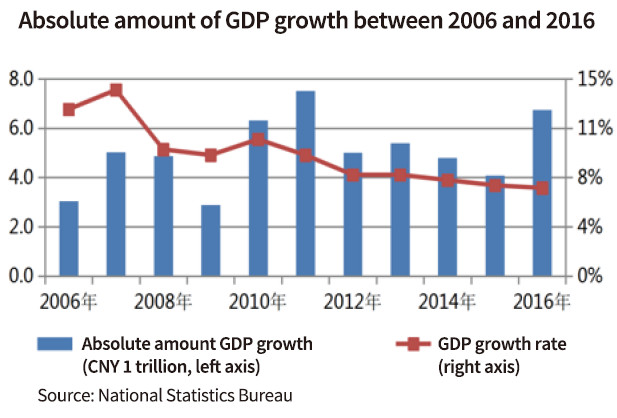
If we calculate the absolute value of GDP growth in each year, namely the GDP of current year minus the GDP of last year, we will find that the annual growth is relatively stable. Before 2008, the incremental GDP per year was between CNY 4-5 trillion, which is at the same level of recent two years. Therefore, I think it is a bit misleading to say “the economic growth in China is slowing down, and the downward pressure is increasing”. The absolute value of GDP growth is not declining significantly. The slowing GDP growth is due to the increased dominator and cardinal number.
According to the data released by the National Statistics Bureau in January 2017, the GDP in 2016 already reached CNY 74.4 trillion. As the dominator gets bigger and bigger, the decline of growth rate is reasonable. Therefore, I think there is no need to be anxious, or take some short-term stimulating measures to maintain the growth rate of GDP. Based on the aforesaid calculation, the incremental GDP will be the same with that of the period before 2008 if the growth rate reaches 5%. Therefore5% shall be satisfactory in my opinion.
On the other hand, I think we should pay close attention to the notable decline of allocation efficiency of financial resources after the financial crisis in 2008. According to the estimation in a report issued by the International Monetary Fund (IMF) last year, before 2008, CNY 1.2 of loan increment could produce CNY 1.0 of incremental GDP in China, but after 2008, the so-called credit density has remarkably increased. In other words, it requires more than CNY 3 of loan increment to generate CNY 1 of incremental GDP.
Meanwhile, the M2 broad money supply in China had steeply risen from CNY 47 trillion in 2008 to CNY 155 trillion in 2016, which means that M2 was increased by over CNY 100 trillion during eight years. At present, the M2 has exceeded USD 20 trillion, which is bigger than world’s largest economies like the US and EU in absolute value. The M2/GDP ratio has also reached more than 200%.

These figures show that: Although the total amount of loan and financial resources is increasing rapidly, the allocation efficiency of financial resources is conspicuously deteriorated. That is to say, a large amount of money has been allocated to inefficient areas, or even wasted, resulting in the more and more serious phenomena of “the financial institutions sector does not support the real economy”.
Question: Whether the phenomenon of “the financial institutions sector does not support the real economy” is related with the uprising overall leverage ratio in China? As measured by the Chinese Academy of Social Sciences (CASS) and other agencies, the total debt by the end of 2015 reached CNY 168 trillion, and the ratio between the total debt and GDP reached 249%, whereas this ratio in 2008 was lower than 160%. The uprising overall leverage ratio is also a major concern of the outside world on China’s economy
ZHONG Ninghua: Yes, they are relevant. After the financial crisis, the increased overall leverage ratio is caused by the non-financial enterprises in China. The proportion of total debt of such enterprises in GDP increased from below 100% before 2008 to 163% in June 2015. Last year, I published an article entitled “The Structural Problem of China’s Non-financial Corporate Debt” in Economic Research Journal, the best economic journal in China, jointly with several collaborating authors to specially analyze the debt of non-financial enterprises in China.
In the research, we have analyzed the data of all industrial enterprises above designated scale in China during the period of 1998-2013 (nearly four million enterprises). We found that, the average debt ratio (total debt/total assets) of the four million enterprises declined continuously from 65% in 1998 to 51% in 2013, which means 14% decrease in fifteen years and an average annual decline of nearly 1%.

That is to say, during the past sixteen years, there was a significant and universal “deleveraging” trend among the enterprises above designated scale in China. When we first saw this result, we felt a bit incredible. The debt rate of China’s non-financial enterprises was in the “record high”, isn’t it true? Then why we saw the continuously declining average debt ratio?
Later, we speculated that the increased debt ratio might be concentrated on a small proportion of enterprises. Therefore, we classified the four million enterprises in various ways, and then look at the changes in the debt ratio of these sub-samples.. We found that the enterprises have leveraged were mostly large scale, state-owned and listed companies. In addition, China’s enterprise debt was “surprisingly” centralized. For example, in 2013, there were about 345,000 enterprises in the database of industrial enterprise, and the total liabilities of these enterprises were CNY 49.1 trillion. Among them, the total liabilities of the 500 enterprises with the highest debt were CNY 13.5 trillion, and the total liabilities of the 2,000 enterprises with highest debt were CNY 23.5 trillion. In the following diagram, the total debt of the 500 enterprises with the highest debt accounted for 1/4 of the total debt of the 345,000 enterprises, and the total debt of the 2,000 enterprises with the highest debt held nearly 1/2. I only put 5,000 enterprises in this diagram, but their total debt accounted for 55% of the total debt of CNY 49.1 trillion. However, there were 340,000 enterprises left, and their total debt accounted for only 45%.
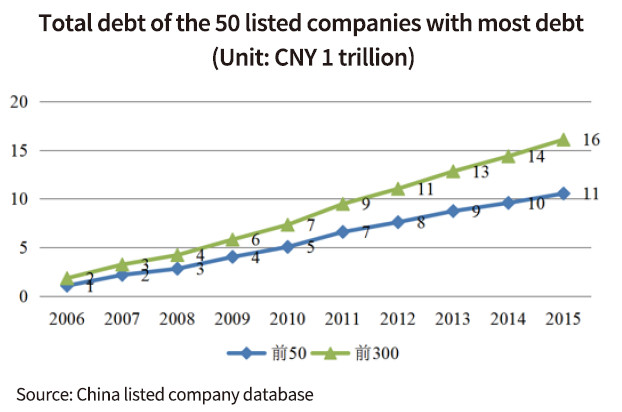
Moreover, according to our calculation, the total debt of the 50 listed companies with the largest amount of debt reached CNY 11 trillion in 2015, which accounted for 54% of the total debt of all listed companies, and the average debt per company exceeded CNY 200 billion. The total debt of the 300 listed companies with the largest amount of debt reached CNY 16 trillion in 2015, which accounted for 82% of the total debt of all listed companies, and the average debt per company exceeded CNY 50 billion.
It is the structural problem on China’s corporate debt: the increased debt ratio is mainly concentrated on the several thousand enterprises. Only a small number of enterprises, mostly large scale, state-owned, listed companies, are accumulating a large amount of debt rapidly. Meanwhile, the debt ratio of most non-listed industrial enterprises in China between 1998 -2013 was declining, and the small and medium private enterprises could hardly get loan. Although the total loan amount was rapidly growing, namely M2 increased by CNY 100 trillion during eight years, most money was allocated to the several thousand enterprises through the financial system in China; however, a large number of efficient and productive enterprises and projects could not get the financial support. Therefore, we can see the phenomenon of continuously uprising overall leverage ratio, difficult financing of small and medium sized private enterprises and financial institutions failing to support the real economy.
Question: Through summarizing the experience and lessons learned since 2008, how to realize stabilized growth, transition and upgrading of the economy in the future?
ZHONG Ninghua: As I mentioned earlier, we can lower the requirement on GDP growth rate. As long as the incremental GDP is maintained at CNY 4 trillion to 5 trillion per year, just as before 2008, the declined GDP growth rate caused by increased cardinal number is acceptable. In order to keep the absolute value of GDP growth, I think we should take more measures to stimulate consumption rather than let the state-owned enterprises to invest. In particular, there are some poor areas in the Midwest; and many rural areas in China are still in the process of urbanization, i.e. the rural population is turning into urban population. We can combine the targets of poverty relief, urbanization and steady growth. For example, we can improve the income levels and consumption capabilities of the population in poor areas through fiscal policies such as tax reduction and consumption subsidy; and raise the consumption capabilities of the population in rural regions through rural infrastructure construction and social insurance coverage.
In addition, the US government may intensify Sino-US trade disputes through raising taxes and other means. As a response, we can take advantage of the opportunity to encourage export enterprises to explore the inland and rural markets. We can reduce the export subsidies and tax relief to these enterprises, and increase the domestic consumption subsidies to promote the transition to the sustainable mode of relying on consumption and domestic demand.
ADD:Tongji Building A, Siping Road 1500, SHANGHAI 200092
TEL:0086-21-65983943
FAX:0086-21-65986304
Quick Links:Tongji UniversityMMBSMBSCWRXLRI

We protect your privacy. We use cookies to personalize content, provide features, and analyze traffic to our website anonymously and in a privacy compliant manner. By law, we may store cookies on your device if they are strictly necessary for the operation of this site. For all other cookie types, we need your permission. For more information, please see the privacy policy linked below.

